Temperature Chart of Copenhagen
by: gnuplot
This displays a graph showing the temperature in Copenhagen over time. The graph is divided into two sections, one for maximum and minimum temperatures and another for average precipitation. The maximum temperature line shows that the highest temperature recorded was 10 degrees Celsius on January 27th. On the other hand, the lowest temperature recorded was -5 degrees Celsius on December 3rd. The average precipitation line indicates that the most rainfall occurred in July with a total of 14 millimeters. The least amount of rainfall was observed in January with only 2 millimeters. This chart provides valuable information about the climate and weather patterns in Copenhagen, which can be useful for residents and visitors planning their activities accordingly.
This is a completely free image Temperature Chart of Copenhagen that you can download, post, and use for any purpose.
SVG files are the highest quality rendering of this drawing, and can be used in recent versions of Microsoft Word, PowerPoint, and other office tools.
Download as PNG File 640px x 500px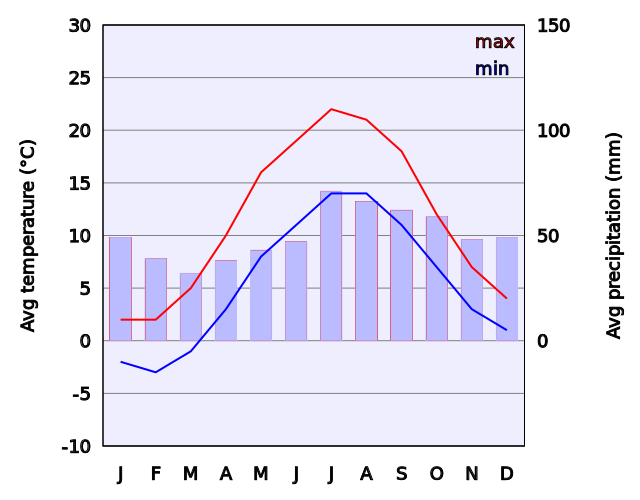
PNG files are the most compatible. Use this on your web page, in your presentation, or in a printed document.
Download as Word DocumentA Word document (docx) containing just the image. Ready to use in Microsoft Word, or LibreOffice.